
Inhaltsverzeichnis
01 Der wahre Preis des Billigen | 02 Stromverbrauch Erklärt | 03 Stromkostenrechner | 04 Modulausfall & Austausch | 05 Kalibrierungskosten | 06 Ausfallzeiten & Umsatzverluste | 07 5-Jahres Gesamtkostenvergleich | 08 Was vor dem Kauf zu prüfen ist | ✓ TCO-Checkliste | FAQ
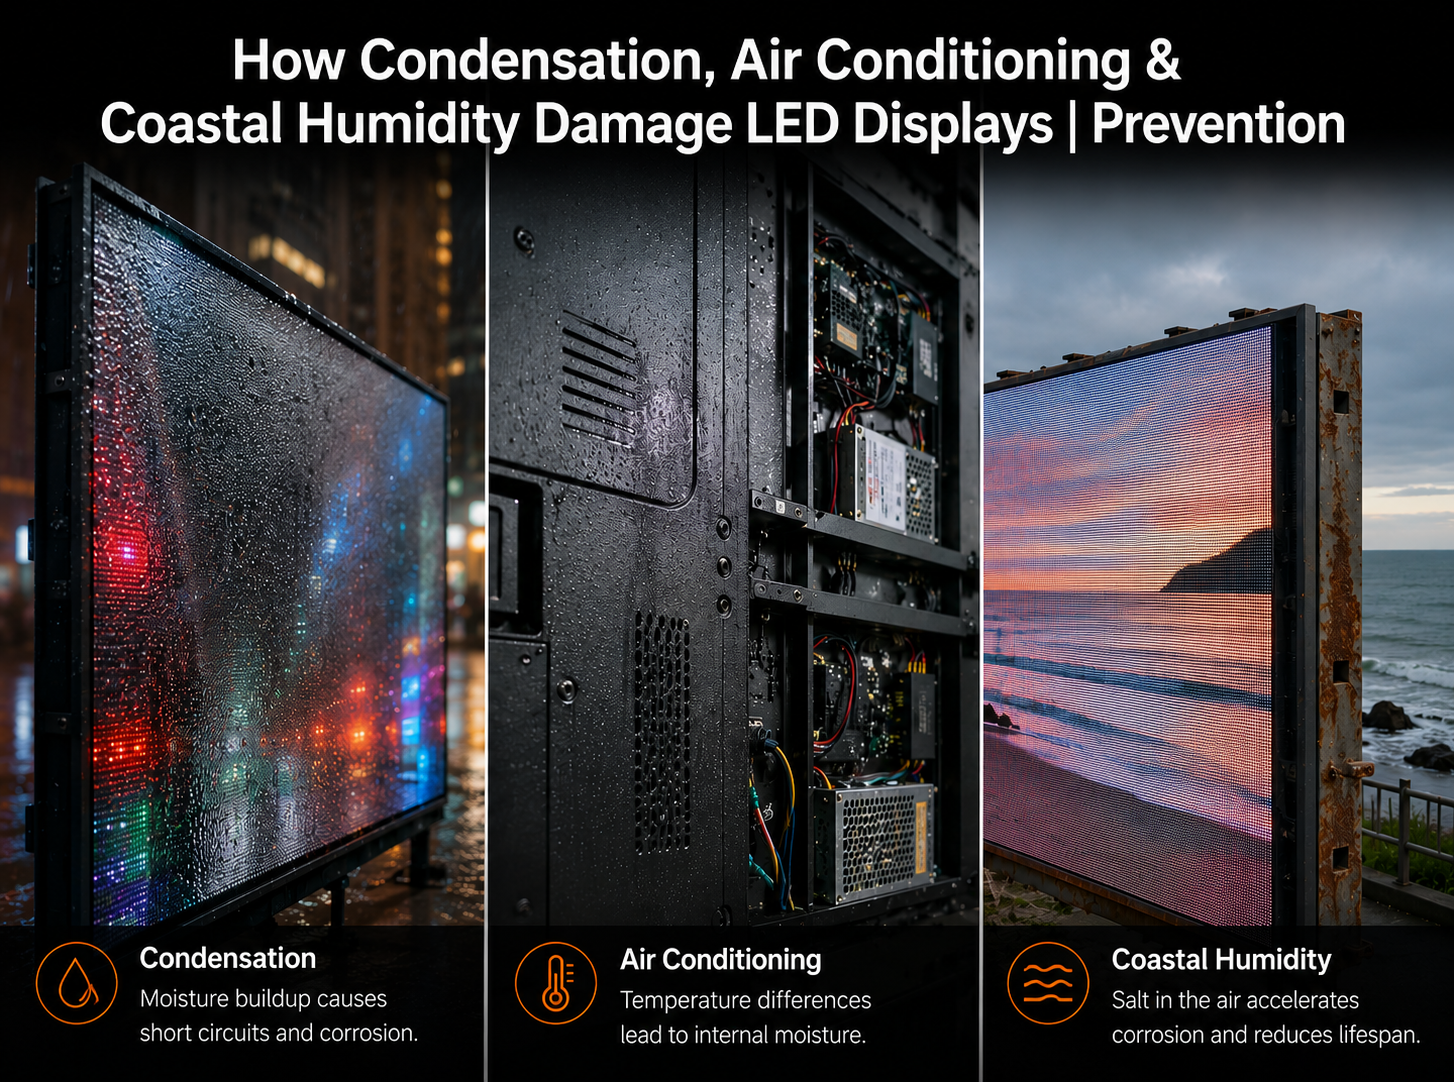
Der Kaufpreis eines LED-Displays ist die Zahl, auf die sich jeder Käufer konzentriert. Er ist auch die am wenigsten wichtige Zahl in der Berechnung der Gesamtbetriebskosten. Ein Display, das zum Kaufzeitpunkt 30 % weniger kostet, kann über fünf Jahre 200 % mehr kosten, wenn Stromverbrauch, Wartungsarbeiten, Modulaustausch und Umsatzverluste durch Ausfallzeiten berücksichtigt werden. Dieser Leitfaden beziffert die versteckten Kosten, die Käufer von billigen LED-Displays zu spät entdecken.
Die LED-Display-Branche hat ein Problem mit der Preistransparenz. Anbieter konkurrieren aggressiv um den Kaufpreis, da dies die Zahl ist, die Käufer vergleichen. Die laufenden Kosten – Strom, Wartung, Modulaustausch, Kalibrierung und Ausfallzeiten – sind zum Zeitpunkt des Verkaufs unsichtbar und tauchen selten in den Angeboten der Anbieter auf.
Dies führt zu einer systematischen Verzerrung des Marktes: Käufer wählen konsequent Produkte, die billiger erscheinen, aber über ihre Betriebslebensdauer deutlich mehr kosten. Die Anbieter, die die niedrigsten Kaufpreise anbieten, sind in der Regel diejenigen, die Komponenten von geringster Qualität verwenden – was direkt die Energieeffizienz, Lebensdauer und Wartungshäufigkeit bestimmt.
Das Verständnis des Zusammenhangs zwischen Komponentenqualität und Betriebskosten ist die wichtigste Analyse, die ein Käufer vor der Anschaffung eines LED-Displays durchführen kann.
Bei einem 10m² großen Outdoor-LED-Display, das 12 Stunden am Tag betrieben wird, können eine 30%ige Kaufpreisersparnis von 15.000 € durch die zusätzlichen Stromkosten innerhalb von 3 Jahren vollständig ausgeglichen werden – noch bevor Wartungs-, Modulaustausch- oder Ausfallzeitenkosten berücksichtigt werden.
Der Stromverbrauch von LED-Displays wird hauptsächlich durch die Effizienz der LED-Chips bestimmt – die Menge des Lichtausstoßes (Nits), die pro Watt elektrischer Eingangsleistung erzeugt wird. Erstklassige LED-Chips von Herstellern wie Nationstar haben eine deutlich höhere Lichtausbeute als zweitklassige oder neu verpackte Komponenten. Das bedeutet, dass ein hochwertiges Display die gleiche Helligkeit mit einem Bruchteil des Stromverbrauchs einer minderwertigen Alternative erzeugt.
Die Angaben zum Stromverbrauch auf den Datenblättern von LED-Displays werden typischerweise in zwei Zahlen dargestellt:
- ▸Maximaler Stromverbrauch – der Stromverbrauch bei voller Weißhelligkeit (100 % Weißanteil). Dieser Wert wird im Normalbetrieb selten erreicht und dient hauptsächlich zur Dimensionierung der Stromversorgung. Es ist der Wert, der am häufigsten von Anbietern genannt wird.
- ▸Durchschnittlicher Stromverbrauch – der typische Stromverbrauch bei 25–30 % Helligkeit des Inhalts, was das Betriebslevel für die meisten kommerziellen Inhalte wie Werbegrafiken, Videos und Textanzeigen ist. Dies ist der Wert, der Ihre tatsächliche Stromrechnung bestimmt.
Die Lücke zwischen maximalem und durchschnittlichem Stromverbrauch ist erheblich. Ein Display mit einer maximalen Leistung von 500W/m² verbraucht im Normalbetrieb typischerweise durchschnittlich 150–200W/m². Ein minderwertiges Display kann jedoch aufgrund der geringeren LED-Effizienz durchschnittlich 300–350W/m² verbrauchen – was die Stromkosten für die gleiche visuelle Ausgabe effektiv verdoppelt.
Einige Anbieter blähen den maximalen Leistungswert auf den Datenblättern auf, um den durchschnittlichen Verbrauch proportional niedriger erscheinen zu lassen. Fragen Sie immer explizit nach dem durchschnittlichen Stromverbrauch, gemessen bei 25 % vollem Weißanteil. Kann ein Anbieter diesen Wert nicht liefern, verwenden Sie den Maximalwert für Ihre Stromkostenberechnung – Ihre tatsächlichen Kosten werden dann niedriger als geschätzt, nicht höher.
Die Formel für die jährlichen Stromkosten ist unkompliziert. Die Variable, die die meisten Käufer unterschätzen, sind die Betriebsstunden:
Jährliche Stromkosten = Durchschnittliche Leistung (kW/m²) × Displayfläche (m²) × Betriebsstunden pro Jahr × Strompreis (€/kWh)
Für ein 10m² großes Außenwerbedisplay, das 14 Stunden pro Tag (5.110 Stunden pro Jahr) bei 0,25 €/kWh in Europa betrieben wird:
| Display-Qualität | Durchschnittliche Leistung (W/m²) | Jahreskosten (10m²) | 5-Jahres-Kosten |
|---|---|---|---|
| Niedrige Qualität | 320 W/m² | 4.088 € | 20.440 € |
| Mittelklasse | 200 W/m² | 2.555 € | 12.775 € |
| Hohe Effizienz | 140 W/m² | 1.789 € | 8.945 € |
Der Stromkostenunterschied über 5 Jahre zwischen einem Display geringer Qualität und einem hocheffizienten Display bei einer einzelnen 10m²-Installation beträgt 11.495 € – ein Betrag, der den Kaufpreisunterschied zwischen den beiden Produkten in den meisten kommerziellen Anwendungen typischerweise übersteigt. Die Stromeinsparung allein rechtfertigt die höheren Anschaffungskosten eines Qualitätsdisplays.
Die Ausfallrate von LED-Modulen ist die Wartungskostenvariable mit der größten Varianz zwischen den Qualitätsstufen. LED-Chips der ersten Kategorie werden mit engen Spezifikationstoleranzen und konsistenten Durchlassspannungs- und Luminanzeigenschaften hergestellt. Sie altern langsam und vorhersehbar über ihre spezifizierte Lebensdauer von 80.000–100.000 Stunden. Chips niedrigerer Kategorie – insbesondere neu verpackte Komponenten, die aus anderen Produktionsläufen gerettet wurden – weisen inkonsistente Eigenschaften und deutlich höhere frühe Ausfallraten auf.
Die praktischen Konsequenzen zeigen sich in den Ersatzkosten:
- ▸Hochwertiges Display – Typischer Modulaustauschbedarf beginnt im 4.–6. Betriebsjahr mit 2–5 % der Modulanzahl pro Jahr. Ein 10m²-Display bei 15 €/Modulaustauschkosten: 300–750 €/Jahr ab dem 4. Jahr.
- ▸Minderwertiges Display – Modulausfälle beginnen typischerweise innerhalb von 12–18 Monaten mit 5–15 % der Modulanzahl pro Jahr und eskalierten in den Folgejahren. Bei gleichen Ersatzkosten: 750–2.250 €/Jahr ab dem 1.–2. Jahr, potenziell insgesamt 8.000–15.000 € über 5 Jahre bei einer 10m²-Installation.
Über die direkten Kosten für Ersatzmodule hinaus erfordert jeder Ausfall einen Technikereinsatz – oder führt zu einer wachsenden Anzahl sichtbarer Mängel, wenn der Betreiber die Behebung von Ausfällen verzögert. Techniker-Einsatzkosten in Europa liegen typischerweise zwischen 150 € und 400 € pro Besuch, exklusive Ersatzteile. Ein minderwertiges Display, das 4–6 Modulausfälle pro Jahr verursacht, die Vor-Ort-Besuche erfordern, addiert allein 600–2.400 € jährlich an Arbeitskosten hinzu.
Anbieter mit EU-Lagerbestand können Ersatzmodule innerhalb von 24–48 Stunden nach einer Fehlermeldung versenden und so Ausfallzeiten minimieren. Anbieter, die einen Werksversand aus China erfordern, führen zu Reparaturzeiten von 3–6 Wochen – in dieser Zeit läuft das Display weiterhin mit sichtbaren Mängeln oder bleibt ganz abgeschaltet.
LED-Displays erfordern eine regelmäßige Helligkeits- und Farbneukalibrierung, da einzelne LEDs unterschiedlich schnell altern. Im Laufe der Zeit führen schneller alternde LEDs zu sichtbaren Ungleichmäßigkeiten auf der Displayoberfläche – ein Patchwork-Effekt, bei dem einige Bereiche heller oder in einem anderen Farbton erscheinen als andere. Eine professionelle Neukalibrierung stellt die Gleichmäßigkeit wieder her, indem die Ausgabe jedes Pixels an einen gemeinsamen Referenzwert angepasst wird.
Die Häufigkeit der erforderlichen Kalibrierung hängt direkt von der Konsistenz des Leuchtdichteverlusts über die LED-Population ab – was durch die Komponentenqualität bestimmt wird:
- ▸Hochwertiges Display – Jährliche Kalibrierung ist typischerweise ausreichend für die ersten 5 Jahre. Kosten: 300–800 € pro Kalibrierungsbesuch = 1.500–4.000 € über 5 Jahre.
- ▸Minderwertiges Display – Ungleichmäßigkeiten typischerweise innerhalb von 12–18 Monaten sichtbar, erfordert Kalibrierung alle 4–6 Monate. Kosten: 300–800 € × 2–3 Besuche pro Jahr = 3.000–12.000 € über 5 Jahre.
Beachten Sie, dass die Kalibrierung eine Grenze hat: Sobald die LED-Degradation schwerwiegend genug ist, kann eine Neukalibrierung die akzeptable Gleichmäßigkeit nicht mehr wiederherstellen. Zu diesem Zeitpunkt ist die einzige Lösung ein teilweiser oder vollständiger Plattenaustausch – ein Ergebnis, das typischerweise im 3.–4. Jahr bei minderwertigen Displays und im 8.–12. Jahr bei hochwertigen Installationen eintritt.
Für umsatzgenerierende LED-Display-Anwendungen – wie Außenwerbeplakate, digitale Einzelhandelsbeschilderungen, Mietbildschirme für Veranstaltungen – haben Ausfallzeiten direkte finanzielle Kosten, die in keinem Lieferantenangebot enthalten sind, aber alle anderen Kostenkategorien zusammen übersteigen können.
- ▸Außenwerbetafel — Eine Werbetafel, die €800/Monat an Werbeeinnahmen generiert, verliert €27 pro Tag Ausfallzeit. Ein minderwertiges Display mit durchschnittlich 15 Ausfalltagen pro Jahr kostet €405/Jahr an verlorenen Werbeeinnahmen – zuzüglich Reparaturkosten und etwaiger Vertragsstrafen gegenüber Werbekunden bei Nichterfüllung. Über 5 Jahre: €2.025 an verlorenen Einnahmen vor Reparaturkosten.
- ▸Digitale Einzelhandelsbeschilderung — Ein stark frequentiertes Einzelhandelsdisplay, das eine messbare Umsatzsteigerung von 3–5% pro Betriebstag bewirkt, verliert diese Steigerung an jedem Ausfalltag. Für einen Einzelhandelsstandort mit €10.000/Tag an beeinflussten Verkäufen kostet jeder Ausfalltag €300–€500 an entgangenem Mehrumsatz – eine Zahl, die selten in einer Gesamtkostenberechnung erscheint, da sie ein Attributionsmodell zur Quantifizierung erfordert.
- ▸Event-Vermietung — Ein Display-Ausfall während einer Live-Veranstaltung hat eine Null-Toleranz bei Ausfallzeiten. Die Kosten werden nicht in Umsatz pro Tag gemessen, sondern in Kundenreputation, Vertragsstrafenklauseln und dem Risiko einer Veranstaltungsabsage. Ein einziger hochkarätiger Ausfall kann die gesamte Marge der LED-Display-Investition eines Vermietungsunternehmens zunichtemachen.
Der folgende Vergleich verwendet ein 10m² großes LED-Display für Außenwerbung, das 14 Stunden pro Tag in einem europäischen Markt bei einem Strompreis von €0,25/kWh betrieben wird. Alle Angaben sind ungefähre Bereiche basierend auf Branchen-Wartungsdaten.
| Kostenkategorie | Minderwertiges Display | Mittelklasse-Display | Hochwertiges Display |
|---|---|---|---|
| Kaufpreis (10m²) | €30.000 | €45.000 | €60.000 |
| 5-Jahres-Stromkosten | €20.440 | €12.775 | €8.945 |
| 5-Jahres-Modulwechsel | €8.000–€15.000 | €2.000–€4.000 | €500–€1.500 |
| 5-Jahres-Kalibrierung | €3.000–€12.000 | €2.000–€4.000 | €1.500–€4.000 |
| 5-Jahres-Technikereinsätze | €3.000–€12.000 | €1.000–€3.000 | €300–€800 |
| 5-Jahres-Gesamtbetriebskosten | €64.440–€89.440 | €62.775–€68.775 | €71.245–€75.245 |
Das Ergebnis ist kontraintuitiv, aber konsistent: Das minderwertige Display mit dem niedrigsten Kaufpreis verursacht in fast jedem Szenario die höchsten Gesamtbetriebskosten über 5 Jahre. Das Mittelklasse-Display liefert in der Regel das beste Gesamtkostenergebnis, während der höhere Kaufpreis des hochwertigen Displays teilweise durch niedrigere laufende Kosten ausgeglichen wird – und vollständig, wenn der Umsatzverlust durch Ausfallzeiten berücksichtigt wird.
Drei Fragen identifizieren das meiste Risiko, bevor man sich zu einem LED-Display-Kauf verpflichtet:
- ▸"Wie hoch ist der durchschnittliche Stromverbrauch bei 25% weißem Vollbildinhalt?" — Dieser Wert bestimmt Ihre jährlichen Stromkosten. Kann der Lieferant ihn nicht angeben oder nur einen Maximalwert nennen, verwenden Sie 35% des Maximalwerts als grobe Schätzung und berechnen Sie die 5-Jahres-Stromkosten mit der Formel in Abschnitt 03 neu.
- ▸"Welche LED-Chip-Marke und Bin-Code werden verwendet, und wie hoch ist die angegebene L70-Lebensdauer?" — L70 ist der Punkt, an dem die LED-Leuchtdichte auf 70% der ursprünglichen Helligkeit abgenommen hat. Erstklassige Chips erreichen L70 bei 80.000–100.000 Stunden. Wenn ein Lieferant L70 bei 50.000 Stunden angibt oder den Wert nicht liefern kann, sind die Komponenten nicht erstklassig und die Wartungskosten werden höher sein.
- ▸"Wo werden Ihre Ersatzteile auf Lager gehalten und wie lange ist die Lieferzeit?" — Ein EU-Lagerbestand mit 24–48 Stunden Versand ist die einzig akzeptable Antwort für kommerzielle Anwendungen, bei denen Ausfallzeiten Umsatzkosten verursachen. Ein Versand aus China innerhalb von 3–6 Wochen ist kein Garantieservice – es ist eine Umsatzwiederherstellungsperiode auf Kosten des Betreibers.
Bevor Sie einen LED-Display-Kauf genehmigen, vergewissern Sie sich, dass die folgenden Kostenfaktoren im Gesamtbudget enthalten sind:
- ✓ 5-Jahres-Stromkosten berechnet mit durchschnittlichem Stromverbrauch bei 25 % Helligkeit
- ✓ LED-Chip-Marke, Bin-Code und L70-Lebensdauer bestätigt
- ✓ Modulersatzkosten pro Einheit bestätigt und jährliche Austauschrate geschätzt
- ✓ Jährliche Kalibrierungsservicekosten budgetiert und Kalibrierungsfrequenz mit dem Lieferanten bestätigt
- ✓ Technikereinsatzpauschale und geschätzte jährliche Besuche budgetiert
- ✓ Standort der Garantieersatzteile und Lieferzeit bestätigt
- ✓ Umsatzverlust pro Ausfalltag für kommerzielle Werbeanwendungen berechnet
- ✓ Gesamtbetriebskosten über 5 Jahre aller in die engere Wahl gezogenen Lieferanten verglichen – nicht nur der Kaufpreis
Die LED-Display-Reihe von VMX Visual verwendet standardmäßig Nationstar-LEDs und Macroblock-Treiber-ICs, mit Ersatzteillagern in Belgien, Italien und Frankreich für einen Ersatzteilversand innerhalb von 24–48 Stunden. Jedes Panel wird mit vollständiger Komponentendokumentation, einschließlich LED-Chip-Spezifikation und Bin-Code, geliefert.
Kostengünstige LED-Displays verwenden typischerweise ältere oder weniger effiziente LED-Chip-Designs mit höherem Stromverbrauch pro Nit Helligkeit. Ein Display mit 400 W/m² Durchschnittsverbrauch im Vergleich zu einem effizienten Modell mit 200 W/m² verdoppelt Ihre jährlichen Stromkosten bei identischem Inhalt. Die Angaben zum Stromverbrauch in Datenblättern zeigen oft Spitzenwerte, keine Betriebsdurchschnittswerte. Fragen Sie immer nach dem durchschnittlichen Stromverbrauch bei 25–30 % Helligkeit, was dem typischen Betriebsniveau für die meisten Innenanwendungen entspricht.
Nein. Hochwertige LED-Displays, die Chips der ersten Güteklasse verwenden, sollten innerhalb der ersten 2–3 Jahre des normalen Betriebs keinen Modulaustausch erfordern. Ein frühzeitiger Modulausfall nach 8 Monaten deutet stark auf wiederaufbereitete oder minderwertige LED-Chips, unzureichende Treiber-IC-Qualität oder ein mangelhaftes Wärmemanagement hin. Die Kosten für einen frühzeitigen Modulaustausch übersteigen in der Regel die anfänglichen Einsparungen beim Kaufpreis innerhalb der ersten 2 Betriebsjahre.
Multiplizieren Sie den durchschnittlichen Stromverbrauch (W/m²) × Anzeigefläche (m²) × Betriebsstunden pro Jahr × Strompreis (€/kWh) = jährliche Stromkosten. Für ein 10 m² großes Display, das 14 Stunden/Tag bei 0,25 €/kWh betrieben wird: Ein minderwertiges Display mit 320 W/m² kostet über 5 Jahre allein 20.440 € an Strom, verglichen mit 8.945 € für ein hocheffizientes Display mit 140 W/m². Die Stromeinsparung von 11.495 € über 5 Jahre übersteigt in der Regel die Kaufpreisdifferenz zwischen den beiden Qualitätsstufen.
LED-Chips geringerer Qualität weisen größere Schwankungen in den Luminanzdegradationsraten auf. Helligkeitsungleichmäßigkeiten werden bei minderwertigen Displays innerhalb von 12–18 Monaten sichtbar, im Vergleich zu 3–5 Jahren bei hochwertigen Installationen. Jeder Kalibrierungsbesuch kostet 300–800 €. Ein Display, das alle 6 Monate kalibriert werden muss, verursacht über 5 Jahre Kalibrierungskosten von 3.000–12.000 €, verglichen mit 1.500–4.000 € für ein hochwertiges Display bei jährlicher Kalibrierung.
Bei einer Werbetafel, die 800 €/Monat einbringt, kostet jeder Ausfalltag 27 € an entgangenen Werbeeinnahmen. Ein minderwertiges Display mit durchschnittlich 15 Ausfalltagen pro Jahr kostet 405 €/Jahr an entgangenen Einnahmen, noch bevor Reparaturkosten anfallen. Über 5 Jahre: 2.025 € allein an entgangenen Einnahmen, ohne Technikeranrufe, Ersatzteile und vertragliche Strafen gegenüber Werbekunden. Anbieter mit Ersatzteillagern in der EU können Displays innerhalb von 24–48 Stunden wiederherstellen – im Vergleich zu 3–6 Wochen bei Rücksendungen aus China.


Teilen:
US Lagerlogistik: VG-181 (P1.86) Endkontrolle bestanden & Versandbereit
Fehlerbehebung bei Farbverzerrungen von LED-Displays: Eine vollständige Diagnoseanleitung